

India Housing Launches Exceed Sales for 16th Straight Quarter as Affordable Demand Weakens
Karthik posts articles on Energy and Construction.
Summary
India's housing market is entering a more selective phase after several years of strong post pandemic growth. Developers launched 279,899 homes across India's top eight residential markets during the first nine months of 2026 , while buyers purchased 258,238 homes , according to Knight Frank India. Overall housing sales were broadly unchanged from the same period last year. Launches, however, increased 4% year on year . More importantly, new housing launches have now exceeded sales for 16 consecutive quarters . That does not establish that India has entered a housing glut.
Published on
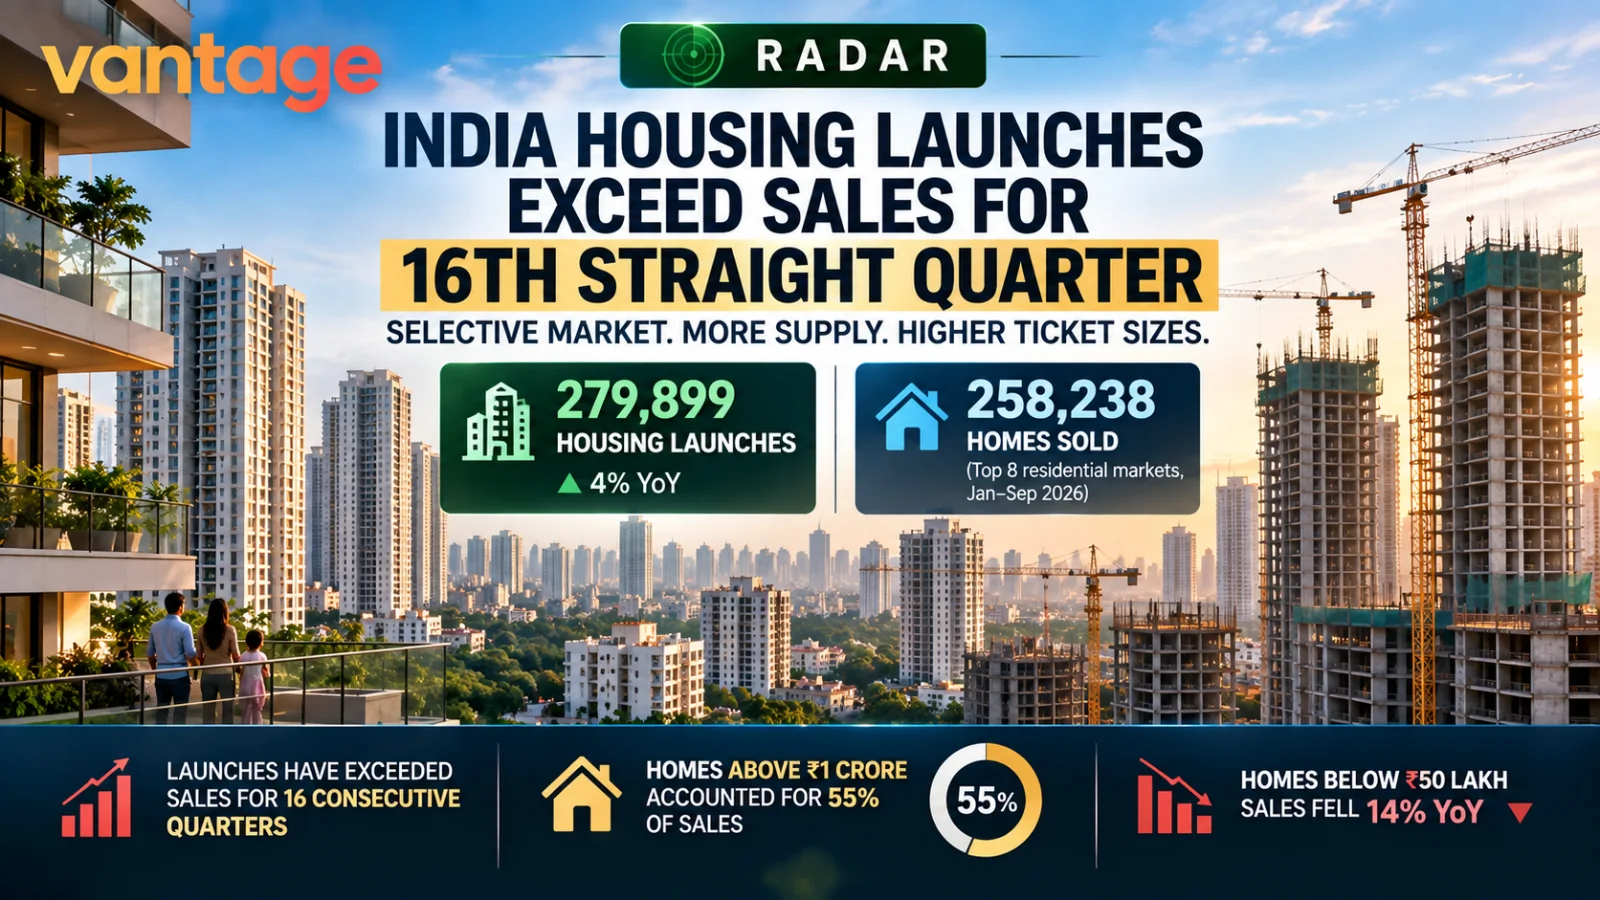
editorial banner contrasting a large pipeline of under-construction residential towers with completed premium housing and an urban family viewing the market. Rising price graphics reinforce the central analysis: housing supply continues to expand, but demand is increasingly concentrated in higher-ticket homes, raising questions about affordability and whether new supply matches the needs of a broad buyer base.
Inline Intelligence
India's housing market is entering a more selective phase after several years of strong post-pandemic growth.
Developers launched 279,899 homes across India's top eight residential markets during the first nine months of 2026, while buyers purchased 258,238 homes, according to Knight Frank India.
Overall housing sales were broadly unchanged from the same period last year.
Launches, however, increased 4% year on year.
More importantly, new housing launches have now exceeded sales for 16 consecutive quarters.
That does not establish that India has entered a housing glut.
But the combination of rising supply, slower absorption and a sharp shift towards higher-priced homes suggests developers and buyers are no longer moving through the market at the same pace.
Knight Frank describes the market as "plateauing", with increasingly different conditions across cities and price segments.
India Housing Sales Remain Flat in the First Nine Months of 2026
Residential sales across the eight markets tracked by Knight Frank stood at 258,238 units in 9M 2026.
The overall number was broadly unchanged year on year.
Mumbai remained the country's largest housing market by volume, recording 72,804 sales, up 1%.
Bengaluru recorded 43,140 sales, an increase of 5%.
Pune recorded 36,402 sales, broadly unchanged.
Hyderabad, Ahmedabad, Chennai and Kolkata recorded increases of approximately 2% to 4%.
NCR was the major exception.
Housing sales there declined 11% year on year to 35,574 units.
The national headline therefore hides significant differences between markets.
Housing Launches Reached 279,899 Units
Developers launched 279,899 units during January to September 2026, an increase of 4% from a year earlier.
That exceeded the 258,238 homes sold during the same period.
The difference between launches and sales was 21,661 units.
This is a Vantage-derived calculation:
279,899 launches minus 258,238 sales = 21,661 units.
It should not be interpreted as an increase of exactly 21,661 units in unsold inventory.
Homes sold during a period can come from projects launched earlier, while newly launched projects may sell over several subsequent quarters.
The calculation simply illustrates the difference between aggregate launches and aggregate sales during the nine-month period.
Launches Have Exceeded Sales for 16 Consecutive Quarters
The persistence of the trend is more important than one quarter's difference.
Knight Frank says housing launches have now exceeded sales for 16 consecutive quarters.
In Q3 2026 alone, developers launched 92,549 homes, up 4% year on year.
Sales during the quarter were 86,767 units, down approximately 1%.
The market is therefore continuing to add new supply faster than current-period sales.
That deserves attention, but it needs to be interpreted alongside inventory absorption.
Quarters-to-Sell Has Risen to 6.1
Knight Frank's quarters-to-sell, or QTS, measure increased to 6.1 quarters in Q3 2026, compared with 5.8 quarters a year earlier.
It was the fourth consecutive quarterly increase and the highest level since Q2 2023.
QTS estimates how many quarters the market would require to sell available inventory at the prevailing sales pace.
A rising figure indicates that inventory is taking longer to absorb.
But context matters.
Knight Frank notes that the current 6.1-quarter level remains below the approximately 7 to 11 quarters recorded between 2018 and 2021.
The data therefore supports slowing absorption, not a conclusion that the market has already returned to an earlier period of severe inventory stress.
India's Housing Market Is Moving Towards Higher-Priced Homes
The most significant structural change may be happening within the sales mix.
Homes priced above ₹1 crore accounted for 55% of housing sales during 9M 2026.
A year earlier, their share was 50%.
At the other end of the market, homes below ₹50 lakh accounted for only 18% of sales, compared with 22% a year earlier.
This means more than half of recorded housing sales across the eight markets now come from homes priced above ₹1 crore.
₹1 Crore to ₹2 Crore Homes Are the Largest Segment
The ₹1 crore to ₹2 crore category was India's largest housing price segment during the period.
Sales reached 77,087 units, an increase of 6.8% year on year.
The segment represented approximately 30% of total housing sales.
The next premium bracket grew even faster.
₹2 Crore to ₹5 Crore Housing Sales Rose 19.4%
Sales of homes priced between ₹2 crore and ₹5 crore increased 19.4% year on year to 51,501 units.
Knight Frank data shows this was the strongest growth among the major price categories highlighted in the report.
Together, the ₹1 crore to ₹2 crore and ₹2 crore to ₹5 crore categories accounted for 128,588 sales.
That equals approximately 49.8% of total 9M housing sales.
This is a Vantage-derived calculation based on Knight Frank's reported segment sales.
It illustrates how concentrated current demand has become in higher-ticket housing.
Affordable Housing Sales Fell 14%
The direction was very different below ₹50 lakh.
Sales in this category fell 14% year on year to 47,660 units.
Its share of overall sales dropped from 22% to 18%.
The decline should not automatically be interpreted as evidence that lower-income households no longer want homes.
Several factors can affect the number of transactions recorded within a price band.
These include:
- rising property prices;
- fewer new projects available below the threshold;
- land and construction costs;
- affordability;
- financing conditions;
- location; and
- developers shifting towards higher-margin products.
Price appreciation can also push homes that previously qualified for a lower price category into a higher bracket.
Premiumisation Is Both a Demand and Supply Story
India's housing premiumisation is often described entirely as a change in buyer preference.
The data requires a more careful interpretation.
Higher-income buyers may indeed be purchasing larger, better-located or more premium homes.
But developers are also supplying more expensive housing.
And sustained property-price appreciation can move the same type of home into a higher ticket-size category over time.
Knight Frank's earlier H1 2026 analysis similarly noted that the growing share of homes above ₹1 crore reflected both demand for premium homes and inventory migrating into higher price bands after sustained price appreciation.
Premiumisation therefore reflects both what buyers want and what the market is offering at current prices.
NCR Was the Weakest Major Housing Market
NCR recorded the clearest regional slowdown.
Sales declined 11% to 35,574 units.
Knight Frank says the weakness was concentrated particularly in the ₹5 crore to ₹10 crore segment.
Sales in that category fell 39% year on year to 4,033 units, compared with 5,002 launches during the nine-month period.
Gurugram accounted for the bulk of the correction and represented 57% of NCR's unsold inventory.
This is significant because NCR has been one of the strongest examples of India's move towards premium and luxury housing.
The data shows that premiumisation does not mean every expensive segment can absorb unlimited supply.
Bengaluru Shows a Different Type of Risk
Bengaluru recorded 5% sales growth during the nine-month period.
Knight Frank also reported strong residential price growth.
But earlier H1 data showed Bengaluru's unsold inventory rising 22% year on year to 74,299 units.
Unsold inventory in the ₹2 crore to ₹5 crore category had risen particularly rapidly in H1.
That does not establish a city-wide oversupply problem.
It does show why sales, launches, inventory and ticket-size mix need to be evaluated together rather than relying on price appreciation alone.
Housing Prices Are Still Rising
Residential prices increased across all markets tracked by Knight Frank in Q3 2026.
Outside NCR and Bengaluru, annual price growth was approximately 3% to 6%.
Bengaluru recorded approximately 11% year-on-year price growth.
Knight Frank noted that Bengaluru's increase may partly reflect the rapid addition of higher-priced inventory to the weighted average.
This is another important analytical warning.
An increase in an average residential price does not necessarily mean every existing home in the city appreciated by the same percentage.
Changes in the mix of homes being launched and sold can influence market averages.
Are India's Housing Launches Becoming Too High?
The available evidence does not support a simple yes or no answer.
Three indicators point towards greater caution:
- launches have exceeded sales for 16 consecutive quarters;
- QTS has risen for four consecutive quarters; and
- overall sales growth has flattened.
But other indicators remain comparatively resilient:
- 258,238 homes were still sold in nine months;
- sales outside NCR increased approximately 2%;
- QTS remains below 2018 to 2021 levels; and
- higher-ticket housing continues to record strong demand.
The more accurate description is a market becoming increasingly selective.
The Bigger Divide May Be Affordable Versus Premium Housing
India's overall housing-sales number looks stable.
The composition underneath it does not.
Homes above ₹1 crore now represent 55% of sales.
Homes below ₹50 lakh represent 18%.
The ₹2 crore to ₹5 crore category grew 19.4%.
Sub-₹50 lakh sales fell 14%.
This creates a broader policy and industry question.
If housing-market growth increasingly depends on buyers capable of purchasing homes above ₹1 crore, what happens to households seeking lower-ticket housing?
The issue is not merely whether total housing sales continue growing.
It is whether new supply remains aligned with the purchasing power of a sufficiently broad group of households.
What Does This Mean for Homebuyers?
Buyers should avoid interpreting rising launches as proof that prices must immediately fall.
Inventory can vary substantially by city, micro-market, developer and price segment.
But a more selective market can create greater negotiating opportunities in areas where supply is building faster than sales.
Buyers should compare:
- completed and upcoming supply;
- unsold inventory;
- recent transaction prices;
- developer incentives;
- construction progress;
- competing projects; and
- the amount of similar inventory scheduled for launch.
The national launch-sales gap is useful context, but individual buying decisions remain local.
What Does This Mean for Developers?
The data increases the importance of product-market fit.
A project cannot rely indefinitely on broad market momentum.
Developers need to assess whether the ticket size, location and product match actual buyer demand.
This is especially important when premium launches continue expanding.
The NCR ₹5 crore to ₹10 crore slowdown demonstrates that even affluent housing categories can experience weaker absorption when supply and demand diverge.
What Should Investors Watch Next?
The most useful indicators over the next few quarters will include:
- quarters-to-sell;
- unsold inventory;
- launches relative to sales;
- affordable-housing sales;
- premium inventory;
- city-level sales growth;
- price growth; and
- developer collections.
If QTS continues rising while sales remain flat and launches continue expanding, inventory risk would become more important.
If launches moderate and sales remain resilient, the current trend may instead represent normalisation after several unusually strong years.
India's Housing Market Is Not One Market
The headline numbers create an apparent contradiction.
Sales are flat.
Launches are growing.
Prices are rising.
Premium homes are selling faster.
Affordable sales are falling.
Inventory absorption is slowing.
All of these can be true simultaneously because India's housing market is fragmented by city, price, product and buyer profile.
The strongest conclusion from the latest Knight Frank numbers is therefore not that housing is booming or collapsing.
It is that the market is becoming more segmented and more dependent on the right product at the right price.
Sixteen consecutive quarters of launches exceeding sales make supply discipline increasingly important.
But the more consequential long-term question may be whether India's residential market can maintain healthy volumes while its centre of gravity continues moving towards higher-priced homes.
Frequently Asked Questions
Are housing launches exceeding sales in India?
Yes. Knight Frank says new housing launches have exceeded sales for 16 consecutive quarters across the major residential markets it tracks.
How many homes were sold in India during the first nine months of 2026?
Knight Frank recorded 258,238 residential sales across India's top eight markets during January to September 2026.
How many new homes were launched in 9M 2026?
Developers launched 279,899 units across the eight markets, up 4% year on year.
Does launches exceeding sales mean India has a housing oversupply problem?
Not automatically. QTS has increased to 6.1 quarters, indicating slower absorption, but Knight Frank says this remains below the 7 to 11-quarter levels recorded between 2018 and 2021. Conditions also differ significantly by city and price segment.
What percentage of Indian home sales are above ₹1 crore?
Homes priced above ₹1 crore accounted for 55% of sales in 9M 2026, compared with 50% a year earlier.
Are affordable housing sales falling?
Sales below ₹50 lakh fell 14% year on year to 47,660 units. However, this price-band decline can reflect affordability pressure, reduced supply and homes migrating into higher price categories as prices rise.
Which housing price segment is growing fastest?
Among the major categories highlighted by Knight Frank, the ₹2 crore to ₹5 crore segment recorded the strongest growth, with sales increasing 19.4% to 51,501 units.
Which major housing market weakened the most?
NCR was the only major market reported as declining overall, with 9M sales down 11% year on year to 35,574 units.
Related Vantage Coverage
Click on article title to view article.
“Homes priced at Rs 1.5 crore-Rs 3 crore emerge as key housing segment” published on 17 August 2026 in Vantage-Radar
Sources
Click on article title to view article.
“Housing launches outpace sales for 16th straight quarter: Knight Frank” published on 5 October 2026 in Business Standard
“Residential Sales in India's Top Cities Reach 1.71 Lakh Units in H1 2026: Knight Frank Report” published on 11 July 2026 in ETRealty
Evidence Caveats
- 258,238 sales and 279,899 launches cover the top eight residential markets tracked by Knight Frank, not every housing transaction or launch in India.
- Launches exceeding sales does not by itself prove oversupply.
- The 21,661-unit difference between 9M launches and sales is a Vantage-derived calculation. It is not the same as an increase in unsold inventory.
- QTS of 6.1 quarters indicates slower absorption, but remains below the 7 to 11-quarter range Knight Frank reported for 2018 to 2021.
- Ticket-size shifts can reflect both changing buyer demand and price appreciation moving properties into higher brackets.
- Average price growth should not be interpreted as appreciation of every individual property.
- The available evidence does not provide a uniform national resale discount, developer incentive, rental yield, household income-to-price ratio or project-level absorption rate.

From TatvaOps
Property Development
Developing a property?
Structured oversight for multi-unit and investor-led builds.
Free quotes · Verified contractors · tatvaops.com
Discuss this article
Join the conversation
Continue this discussion on Forums. A board named like this Radar article is filed under Radar.
More from Real Estate
LTCG and STT: Review Reports Do Not Mean a Tax Cut
Finance Minister Nirmala Sitharaman’s comments on equity taxation have reopened a consequential debate for investors. Speaking at the Bloomberg New Economy Forum in New Delhi on 13 October, she welcomed views on long term capital gains tax and securities transaction tax without committing to…
Blackstone Targets 100 Billion in India Investments
Blackstone aims to double its India investments to approximately $100 billion over about five years, president and chief operating officer Jonathan Gray said in interviews reported this week. The ambition spans private equity and real estate, alongside potential expansion in infrastructure, credit…
Property Registrations Flagged Over Fictitious PAN
Nearly 25,000 property registrations over two years at Badshahpur tehsil in Gurugram reportedly carried the same fictitious PAN, according to The Times of India’s 9 October report on an Income Tax Department survey. The finding raises questions about taxpayer identification and transaction…
Inline Intelligence
Key Insight Actions
Connected knowledge for Housing Market Update
Move between tutorials, discussions, Studio, and hubs without losing context.
Related discussions
Kolkata Captured Just 1 of 6.3 Lakh Crore Housing Sales Value: Should the City Chase Premium Housing?
1 replies
Related discussionIndia Has Had 16 Quarters of Housing Launches Above Sales: Is the Market Building Too Much of the Wrong Housing?
1 replies
Related discussionIf India Removes the 45 Lakh Affordable-Housing Cap, What Should Replace It?
5 replies
Related discussion
Topic hubs
Conclusion Intelligence
Related Discussions
Kolkata Captured Just 1 of 6.3 Lakh Crore Housing Sales Value: Should the City Chase Premium Housing?
Popular in insights discussions1 reply
India Has Had 16 Quarters of Housing Launches Above Sales: Is the Market Building Too Much of the Wrong Housing?
Popular in insights discussions1 reply
If India Removes the 45 Lakh Affordable-Housing Cap, What Should Replace It?
Popular in insights discussions5 replies
Was this helpful?
Let us know what you think