

India Retail Leasing Falls 4.4 in Q3 2026, but High-Street Leasing Jumps 33
Karthik posts articles on Energy and Construction.
Summary
India's retail real estate market produced two very different signals in Q3 2026. Total retail leasing across the top eight cities fell 4.4% year on year to 2.22 million sq ft. But leasing on main streets and high streets increased 33.1% year on year to 1.51 million sq ft , according to Cushman & Wakefield. Shopping mall leasing moved sharply in the opposite direction. Mall leasing fell 37.8% year on year to 0.71 million sq ft , while Grade A mall vacancy declined to just 4.8% . The divergence matters.
Published on
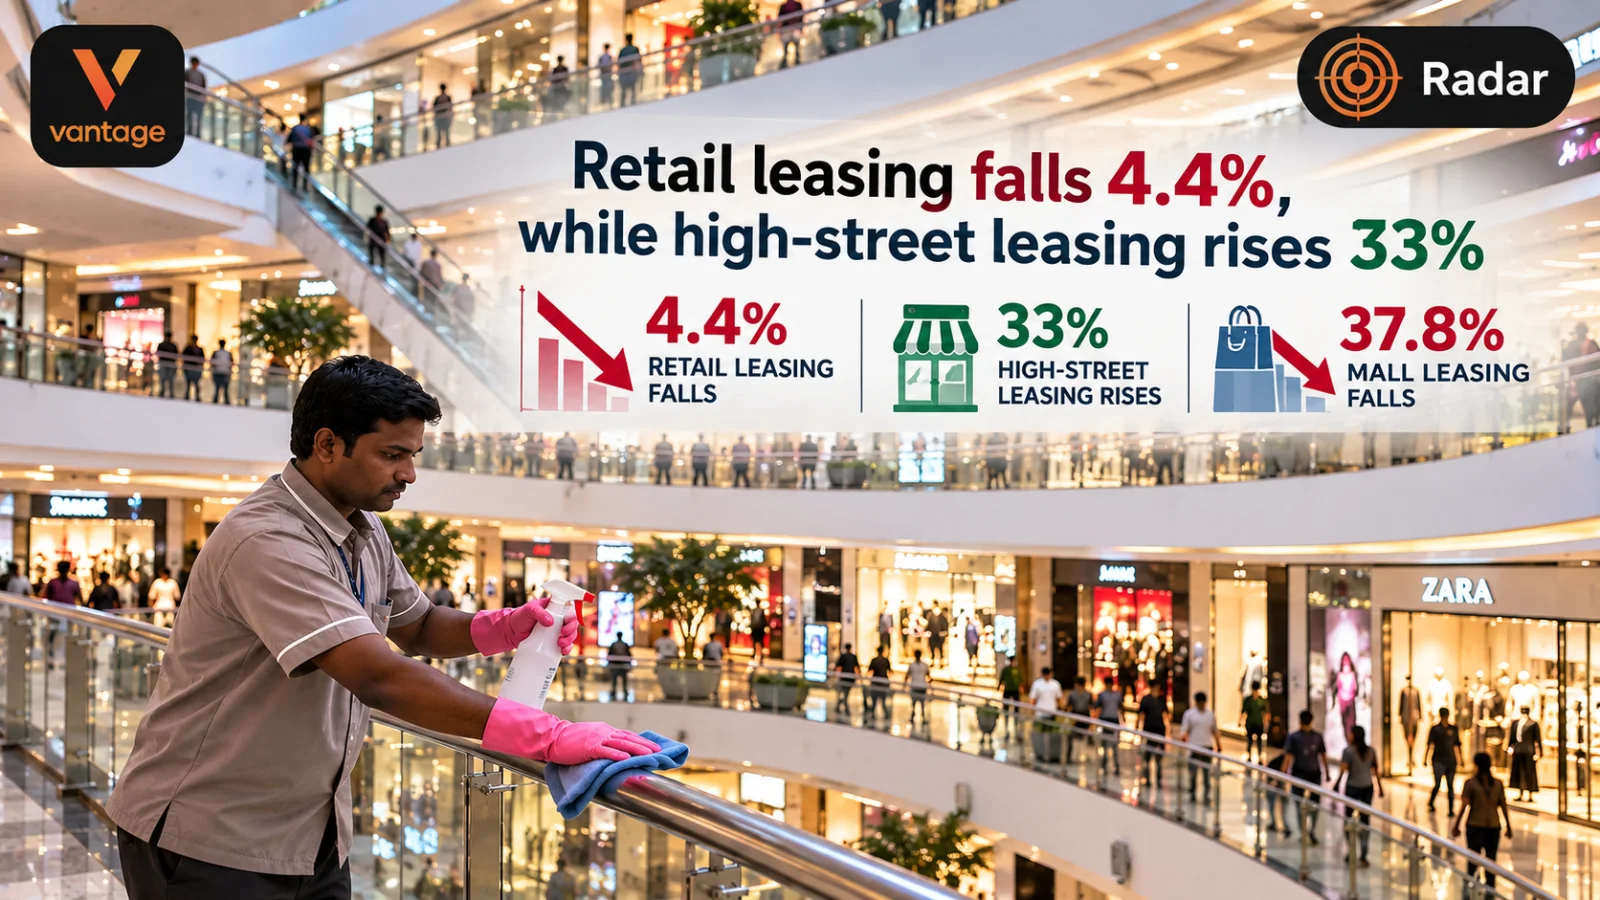
A split-screen editorial visual comparing India's high-street and shopping mall retail markets. A business professional overlooks busy retail environments, with the high-street side highlighting a 33% rise in leasing and the mall side showing a 37.8% decline in mall leasing. The image illustrates the widening divergence between the two retail formats.
Inline Intelligence
India's retail real-estate market produced two very different signals in Q3 2026.
Total retail leasing across the top eight cities fell 4.4% year-on-year to 2.22 million sq ft.
But leasing on main streets and high streets increased 33.1% year-on-year to 1.51 million sq ft, according to Cushman & Wakefield.
Shopping-mall leasing moved sharply in the opposite direction.
Mall leasing fell 37.8% year-on-year to 0.71 million sq ft, while Grade A mall vacancy declined to just 4.8%.
The divergence matters.
A fall in overall leasing might initially suggest weakening retailer demand. But the underlying data shows retailers remained active, with leasing shifting strongly towards high streets while availability in quality malls remained constrained.
For retail landlords, developers and brands, the Q3 story is therefore less about a straightforward demand slowdown and more about where suitable retail space is available.
How Much Retail Space Was Leased in India in Q3 2026?
Gross retail leasing across India's top eight cities reached 2.22 million sq ft in Q3 2026, according to Cushman & Wakefield.
That represented a decline of:
- 4.4% year-on-year
- 7.3% quarter-on-quarter
The eight markets covered were:
- Delhi-NCR
- Mumbai
- Bengaluru
- Hyderabad
- Pune
- Chennai
- Ahmedabad
- Kolkata
The quarterly decline, however, needs to be viewed alongside the longer period.
Retail leasing during January to September 2026 reached 6.57 million sq ft, up a marginal 0.4% year-on-year.
That suggests nine-month leasing was broadly stable even though Q3 volumes declined.
High-Street Retail Leasing Rose 33.1%
The strongest part of the Q3 market was main-street retail.
High-street and main-street locations recorded approximately 1.51 million sq ft of leasing.
That was:
33.1% higher year-on-year
and
29.3% higher quarter-on-quarter.
Main streets accounted for 67.9% of total Q3 retail leasing.
In other words, roughly two-thirds of leasing during the quarter occurred outside shopping malls.
This is one of the clearest signals in the Q3 data.
Retailers were still taking physical stores, but high-visibility street locations captured most of the activity.
Mall Leasing Fell Nearly 38%
Shopping malls recorded a very different quarter.
Mall leasing declined to approximately 0.71 million sq ft, accounting for 32.1% of total leasing.
That represented declines of:
37.8% year-on-year
and
42.1% quarter-on-quarter.
A fall of this magnitude could easily be interpreted as retailers moving away from malls.
But another number complicates that conclusion.
Grade A mall vacancy fell to 4.8%.
No new Grade A mall supply was added for the third consecutive quarter, according to Cushman & Wakefield.
This means lower mall leasing occurred at the same time as available space in quality malls remained very tight.
Is Mall Retail Demand Actually Weakening?
The available evidence does not establish that conclusion.
If mall leasing were falling because retailers broadly no longer wanted mall space, one might expect vacancy to increase as stores closed or tenants reduced their footprints.
Instead, Grade A mall vacancy declined from 5% in Q2 to 4.8% in Q3.
The reviewed evidence also says availability of quality mall space remained constrained.
This creates an important distinction:
lower leasing activity can result from weaker demand, limited available supply, or a combination of both.
In Q3 2026, constrained Grade A mall availability appears to have been an important part of the story.
High Streets Captured 68% of Retail Leasing
The shift becomes clearer when Q3 leasing is divided by format.
Main streets: 67.9%
Malls: 32.1%
A Vantage calculation using the disclosed volumes produces a similar result:
1.51 million sq ft ÷ 2.22 million sq ft = approximately 68.0%
This is a Vantage-derived indicator based on Cushman & Wakefield's reported numbers.
It shows how dominant high-street locations became during the quarter.
Why Are High Streets Attracting Retailers?
Cushman & Wakefield said main streets were supported by retailer demand for prominent, high-visibility locations.
High streets can offer brands several potential advantages depending on the micro-market:
- strong street visibility;
- access to established shopping districts;
- proximity to dense residential or office catchments;
- flexibility in store formats;
- direct frontage; and
- access to locations where quality mall space is unavailable.
But high streets also come with different operating considerations.
Parking, traffic, frontage, building quality, local infrastructure and pedestrian movement can vary significantly from one street to another.
A successful high-street location therefore depends heavily on the individual micro-market.
Delhi-NCR Was India's Largest Q3 Retail Leasing Market
Delhi-NCR recorded approximately 0.55 million sq ft of retail leasing during Q3.
That represented 24.9% of total leasing across the eight cities.
Hyderabad followed with approximately 0.45 million sq ft, while Mumbai recorded 0.35 million sq ft.
Together, Delhi-NCR, Hyderabad and Mumbai accounted for approximately 61% of Q3 leasing.
The remaining cities recorded:
- Bengaluru: 0.24 million sq ft
- Pune: 0.21 million sq ft
- Chennai: 0.18 million sq ft
- Ahmedabad: 0.13 million sq ft
- Kolkata: 0.10 million sq ft
Which Cities Recorded the Strongest Retail Leasing Growth?
The national 4.4% decline conceals significant differences between cities.
Kolkata recorded the strongest percentage increase, with leasing rising 68.8% year-on-year to approximately 0.10 million sq ft.
Bengaluru increased 39% year-on-year.
Hyderabad increased 18.3%, Ahmedabad 15.8%, Chennai 12.1%, and Delhi-NCR 7.9%.
Mumbai and Pune moved in the opposite direction.
Mumbai leasing fell 40.8% year-on-year, while Pune declined 36.2%.
This reinforces why national retail leasing numbers should not be applied uniformly to individual cities.
Domestic Retailers Accounted for 86.3% of Leasing
Indian retailers dominated Q3 activity.
Domestic brands accounted for approximately 1.92 million sq ft, or 86.3% of leasing.
International retailers accounted for approximately 0.30 million sq ft, or 13.7%.
The dominance of domestic brands suggests India's physical retail expansion is not dependent solely on international entrants.
Home-grown retailers remain a major source of demand for commercial retail space.
Fashion Was the Largest Retail Leasing Category
Fashion accounted for 24.9% of Q3 leasing, making it the largest occupier category.
Food and beverage followed at 19.2%.
Accessories and lifestyle brands accounted for 13.1%.
Together, these three categories represented 57.2% of quarterly leasing.
Department stores accounted for 7.8%, while entertainment contributed 7.5%.
This mix shows why physical retail space remains relevant even as ecommerce grows.
Fashion, dining, lifestyle and entertainment can all benefit from physical customer interaction, visibility and experience.
Prime High-Street Rents Increased 6.8%
High-street leasing was not the only metric moving upwards.
Cushman & Wakefield reported that prime high-street rents increased by an average:
2.1% quarter-on-quarter
and
6.8% year-on-year.
This is consistent with strong occupier interest in selected high-visibility locations.
But it should not be interpreted as a 6.8% increase across every high street in India.
Retail rents are highly local and depend on frontage, catchment, pedestrian traffic, brand mix, accessibility and available supply.
Why Low Mall Vacancy Matters for Landlords
A Grade A mall vacancy rate of 4.8% indicates relatively little immediately available space across the surveyed quality mall stock.
For established mall owners, tight vacancy can potentially strengthen leasing conditions when retailers compete for suitable locations.
But low vacancy can also restrict expansion.
A retailer that wants to enter a city may be unable to secure the right store in an established mall.
That can redirect the search towards high streets or other retail developments.
This is why the mall leasing decline and high-street leasing increase should be analysed together.
12.7 Million Sq Ft of New Mall Supply Is Expected Through 2028
The supply constraint may eventually ease.
Cushman & Wakefield expects approximately 12.7 million sq ft of Grade A mall supply across the major markets through 2028.
Approximately 1.35 million sq ft was expected to be completed in 2026, with the remaining pipeline scheduled through 2028.
Delhi-NCR is expected to account for the largest share of the upcoming pipeline, followed by Bengaluru and Chennai.
The arrival of new quality malls could alter the current format mix.
If retailers are currently using high streets partly because suitable mall space is unavailable, new mall completions could unlock leasing demand that cannot presently be accommodated.
That remains a scenario rather than a guaranteed outcome.
What Does the High-Street Boom Mean for Retail Property Investors?
The Q3 numbers strengthen the case for well-located high-street retail assets.
But investors should avoid assuming every street-facing shop benefits equally.
The strongest locations typically depend on factors such as:
- pedestrian traffic;
- affluent catchment;
- road visibility;
- parking;
- nearby offices and housing;
- neighbouring brands;
- frontage;
- store configuration; and
- local supply.
A prime high street can perform very differently from an ordinary neighbourhood retail strip.
The 33.1% national increase therefore does not establish future rent or capital appreciation for any individual property.
What Does This Mean for Mall Developers?
The Q3 numbers present an unusual combination:
mall leasing fell sharply,
but
Grade A mall vacancy also fell.
For developers, that can support the case for additional high-quality retail supply where occupier demand is established.
The challenge is execution.
New malls require the right:
- location;
- catchment;
- tenant mix;
- entertainment offering;
- food and beverage component;
- accessibility; and
- experience proposition.
The 12.7 million sq ft pipeline will therefore matter not only in quantity, but also in quality and location.
What Should Retailers Watch Next?
Retailers choosing between malls and high streets should watch four variables.
Availability
Can the brand secure the right amount of space in the preferred catchment?
Occupancy cost
How do rent and other property costs compare with expected store economics?
Visibility and footfall
Does the location naturally attract the target customer?
Format
Does the brand benefit more from a controlled mall environment or direct high-street frontage?
The answer will differ by category, city and brand strategy.
The Real Q3 Retail Story Is a Shift in Format
The headline says retail leasing fell 4.4%.
That is accurate.
But it does not tell the whole story.
High-street leasing increased 33.1%.
Mall leasing fell 37.8%.
Grade A mall vacancy tightened to 4.8%.
No new Grade A mall supply was added for a third consecutive quarter.
And nine-month total retail leasing remained marginally above the previous year.
Together, these figures suggest Q3 was not simply a weak quarter for physical retail.
It was a quarter in which retailers strongly favoured available high-street locations while quality mall space remained scarce.
That distinction matters for retailers, landlords, developers and commercial-property investors.
Frequently Asked Questions
How much did retail leasing fall in India in Q3 2026?
Gross retail leasing across the top eight cities declined 4.4% year-on-year to approximately 2.22 million sq ft, according to Cushman & Wakefield.
How much did high-street retail leasing grow in Q3 2026?
Main-street leasing reached approximately 1.51 million sq ft, increasing 33.1% year-on-year and 29.3% quarter-on-quarter.
Why did shopping-mall leasing fall in India?
Mall leasing fell 37.8% year-on-year to 0.71 million sq ft. Cushman & Wakefield reported constrained availability of quality mall space, with Grade A mall vacancy falling to 4.8% and no new Grade A supply added for the third consecutive quarter.
Are Indian retailers moving from malls to high streets?
Q3 leasing strongly favoured high streets, which accounted for 67.9% of activity. However, the data does not establish a permanent structural abandonment of malls because tight Grade A mall availability restricted leasing opportunities.
Which city had the highest retail leasing in Q3 2026?
Delhi-NCR led with approximately 0.55 million sq ft, representing 24.9% of leasing across the eight markets.
Which retail categories leased the most space?
Fashion led with 24.9%, followed by food and beverage at 19.2% and accessories and lifestyle at 13.1%.
How much new mall space is expected in India?
Cushman & Wakefield expects approximately 12.7 million sq ft of Grade A mall supply across the major markets through 2028.
Sources
Click on article title to view article.
“India retail leasing falls 4.4% to 2.22 million sq ft in Q3 2026: Report” published on 3 October 2026 in ETRealty
“Retail space leasing in malls falls 38% in Q3 across top 8 cities: Cushman” published on 2 October 2026 in Business Standard
“India’s Retail Leasing Reaches 2.22 MSF in Q3 2026; Grade A Mall Vacancy Tightens to 4.8%: Cushman & Wakefield” published on 1 October 2026 by Cushman & Wakefield
Evidence Caveats
The 4.4% decline refers to gross retail leasing across eight major cities in Q3 2026. It is not a measure of retail sales, consumer spending or retailer revenue.
The 33.1% increase refers specifically to main-street leasing volumes.
The 37.8% decline refers specifically to mall leasing volumes.
Low Grade A mall vacancy and constrained supply provide important context for the mall leasing decline, but the available evidence does not quantify how much of the decline was caused solely by lack of space.
The approximately 68.0% high-street share calculated from 1.51 million sq ft divided by 2.22 million sq ft is a Vantage-derived indicator. Cushman & Wakefield reports the share at 67.9%.
The 12.7 million sq ft mall pipeline is expected future supply. It is not completed space, and completion timing can change.

From TatvaOps
Property Management & Rental Operations
Developing a property?
Structured oversight for multi-unit and investor-led builds.
Free quotes · Verified contractors · tatvaops.com
Discuss this article
Join the conversation
Continue this discussion on Forums. A board named like this Radar article is filed under Radar.
More from Real Estate
LTCG and STT: Review Reports Do Not Mean a Tax Cut
Finance Minister Nirmala Sitharaman’s comments on equity taxation have reopened a consequential debate for investors. Speaking at the Bloomberg New Economy Forum in New Delhi on 13 October, she welcomed views on long term capital gains tax and securities transaction tax without committing to…
Blackstone Targets 100 Billion in India Investments
Blackstone aims to double its India investments to approximately $100 billion over about five years, president and chief operating officer Jonathan Gray said in interviews reported this week. The ambition spans private equity and real estate, alongside potential expansion in infrastructure, credit…
Property Registrations Flagged Over Fictitious PAN
Nearly 25,000 property registrations over two years at Badshahpur tehsil in Gurugram reportedly carried the same fictitious PAN, according to The Times of India’s 9 October report on an Income Tax Department survey. The finding raises questions about taxpayer identification and transaction…
Inline Intelligence
Key Insight Actions
Connected knowledge for Retail Real Estate
Move between tutorials, discussions, Studio, and hubs without losing context.
Related discussions
Topic hubs
Conclusion Intelligence
Related Discussions
India Is Building More Malls, but the Bigger Bet Is on Better Malls
Popular in insights discussions1 reply
Housing Sales Fall 6 percent Across 9 Major Indian Cities in Q3
Popular in radar discussions6 replies
Indias 9.5 Billion Realty Quarter Looks Huge. The Asset Mix Matters More
Popular in insights discussions0 replies
Was this helpful?
Let us know what you think